
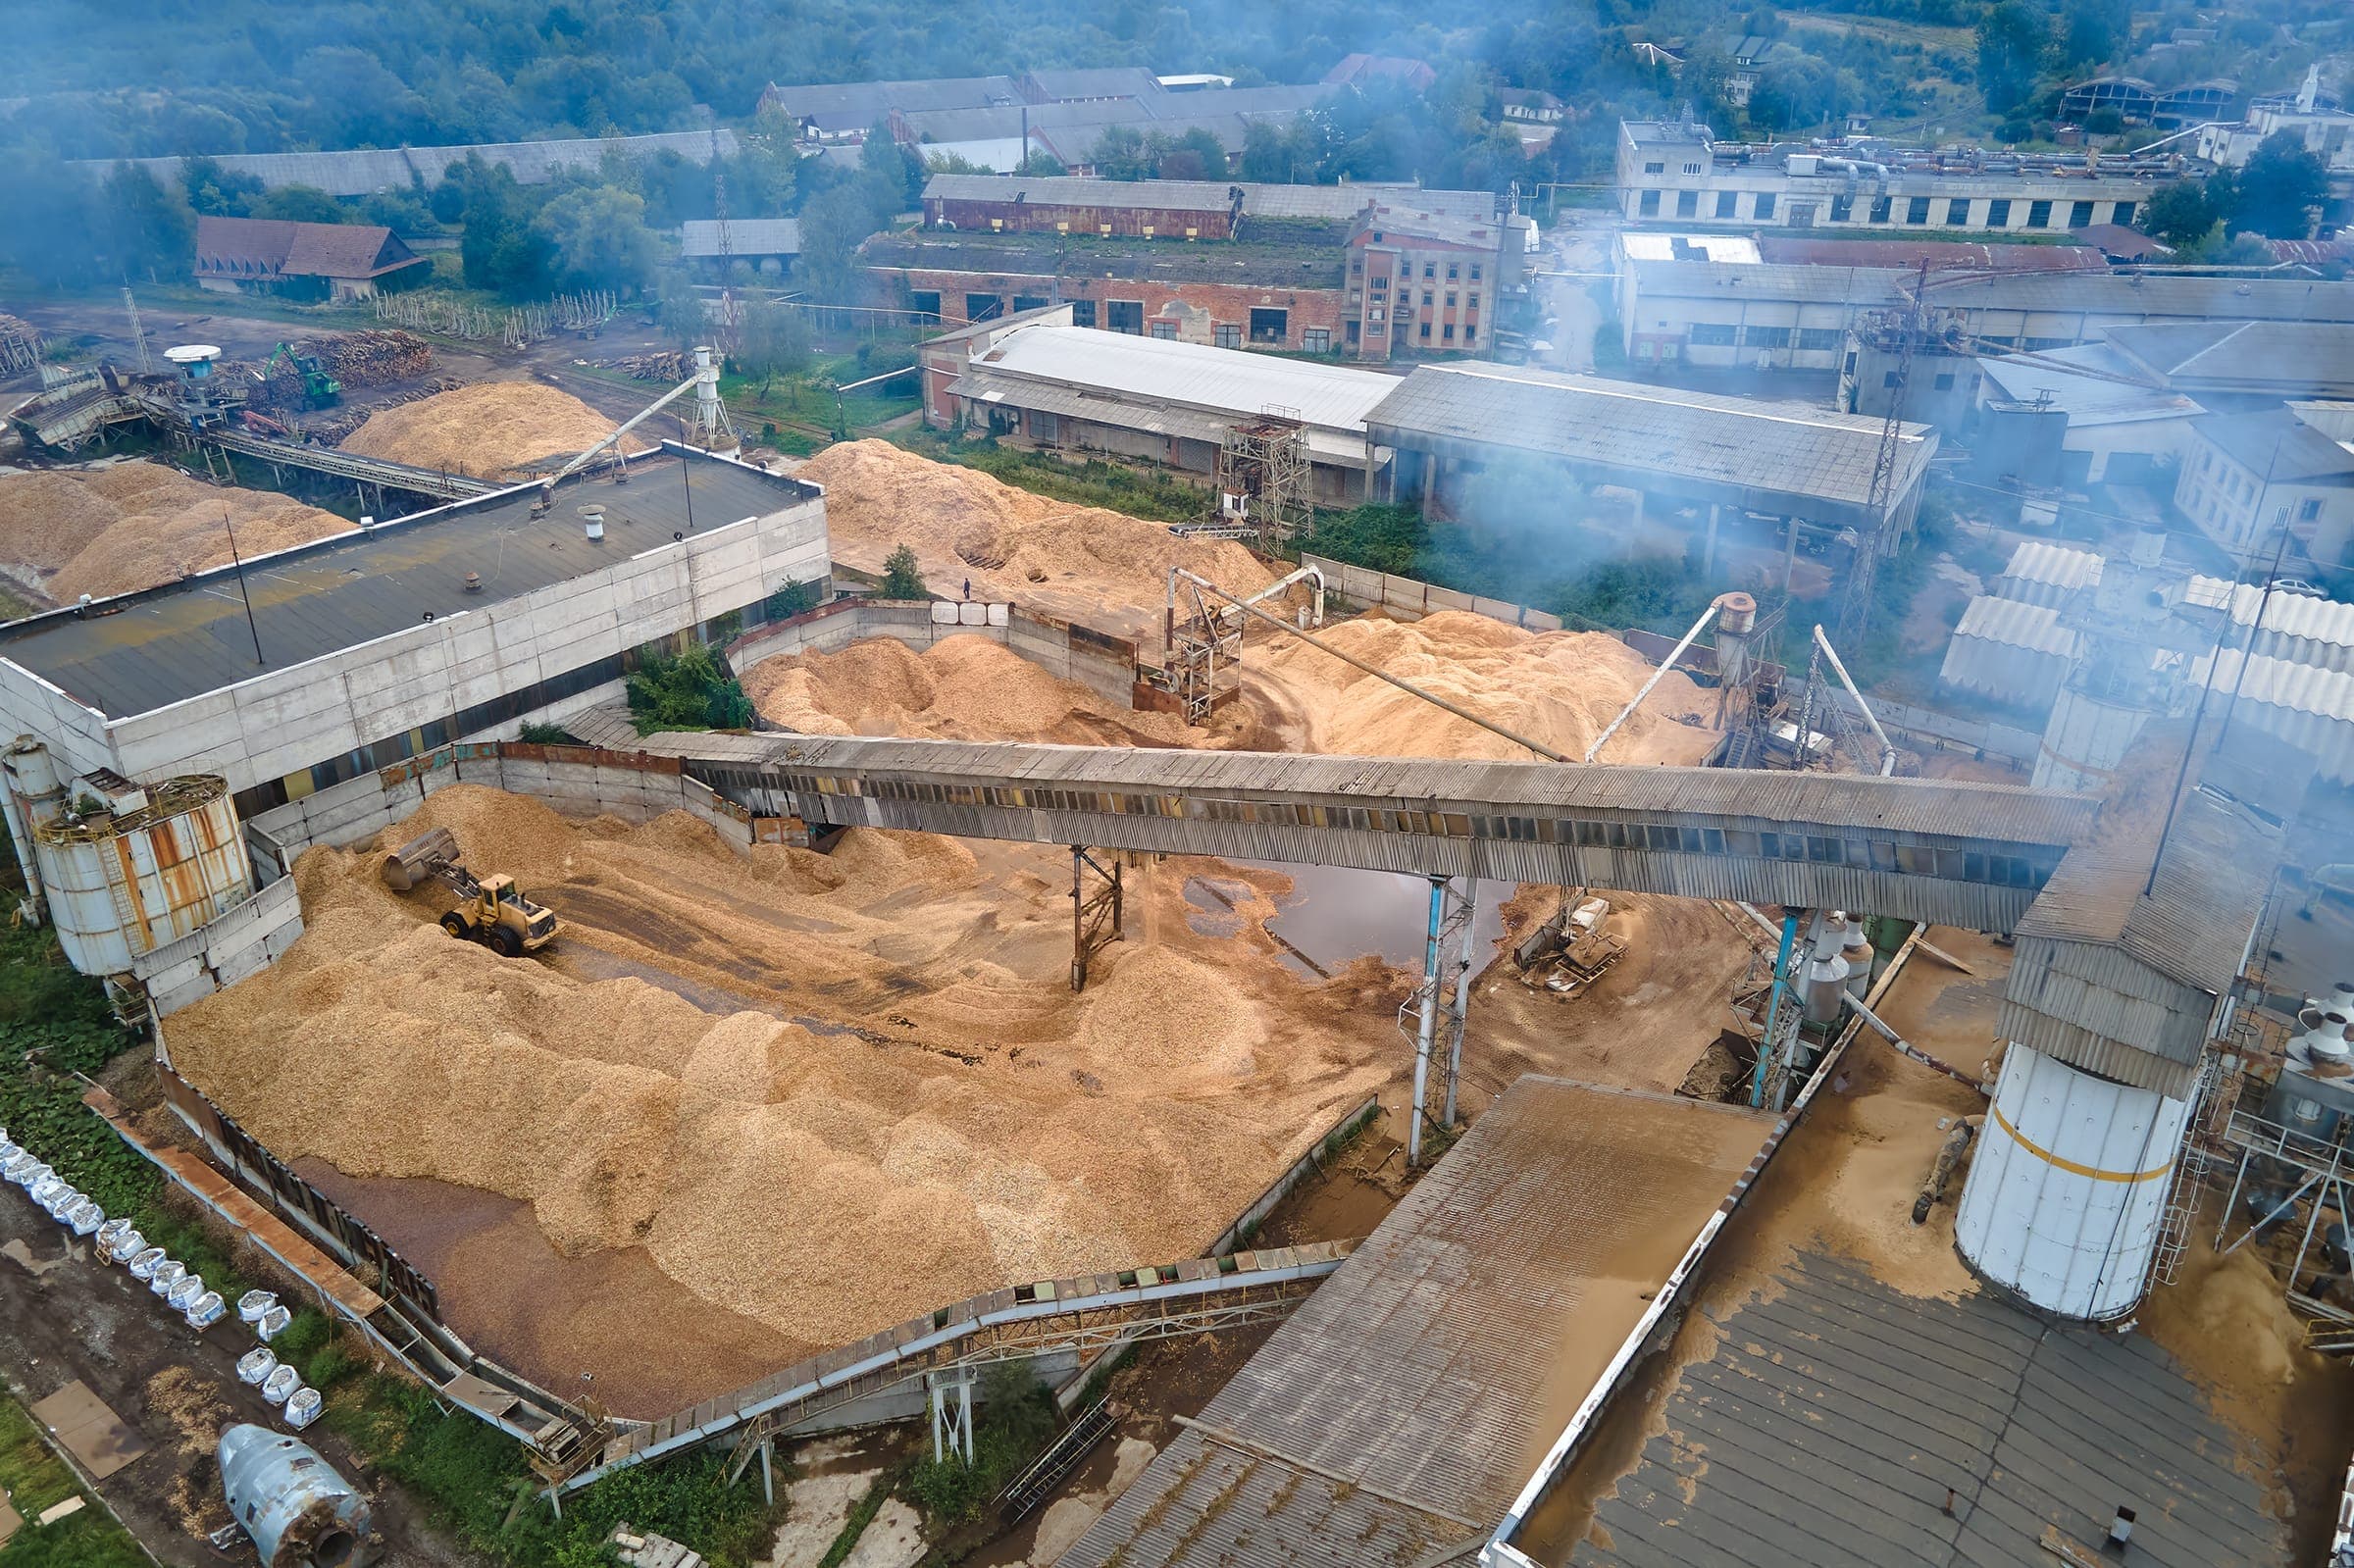
Measure your inventory instead of estimating it.
Counts happen on a calendar. Material moves every day. Rebulk measures what is actually on the ground, in the silo, and in every railcar, so the number you bill from and the number you have are the same number.
Why it happens
The number was never measured in the first place
Inventory accuracy rarely fails at one point. It erodes between counts, through assumptions nobody wrote down.
Counts happen on a calendar
A pile gets measured at month-end or quarter-end. Material moves every day in between, so the number on the books is an estimate that quietly drifts until the next count corrects it.
Estimates carry assumptions
Visual estimates, loader counts, and bulk volume approximations get layered with density assumptions. Each one is defensible alone. Stacked together, they move the number by hundreds of tons.
Survey results arrive after they mattered
A third-party survey takes days to come back. By the time the report lands, the pile has been drawn down and rebuilt, and the number describes a yard that no longer exists.
The pile and the paperwork live apart
Scale tickets sit in one system and physical inventory in another. Shrink shows up as a month-end surprise, and a customer dispute becomes two sets of numbers with no way to settle between them.
How far off is your last pile estimate? Get tonnage from pile dimensions and material density with the free stockpile volume calculator.
How Rebulk solves it
A measured quantity, kept current
Rebulk Inventory builds a 3D model of the pile and the ground underneath it from LiDAR, drone, or mobile capture, then turns that into tons. Small errors in the baseline distort volume at scale, so the ground gets modeled too rather than assumed flat.
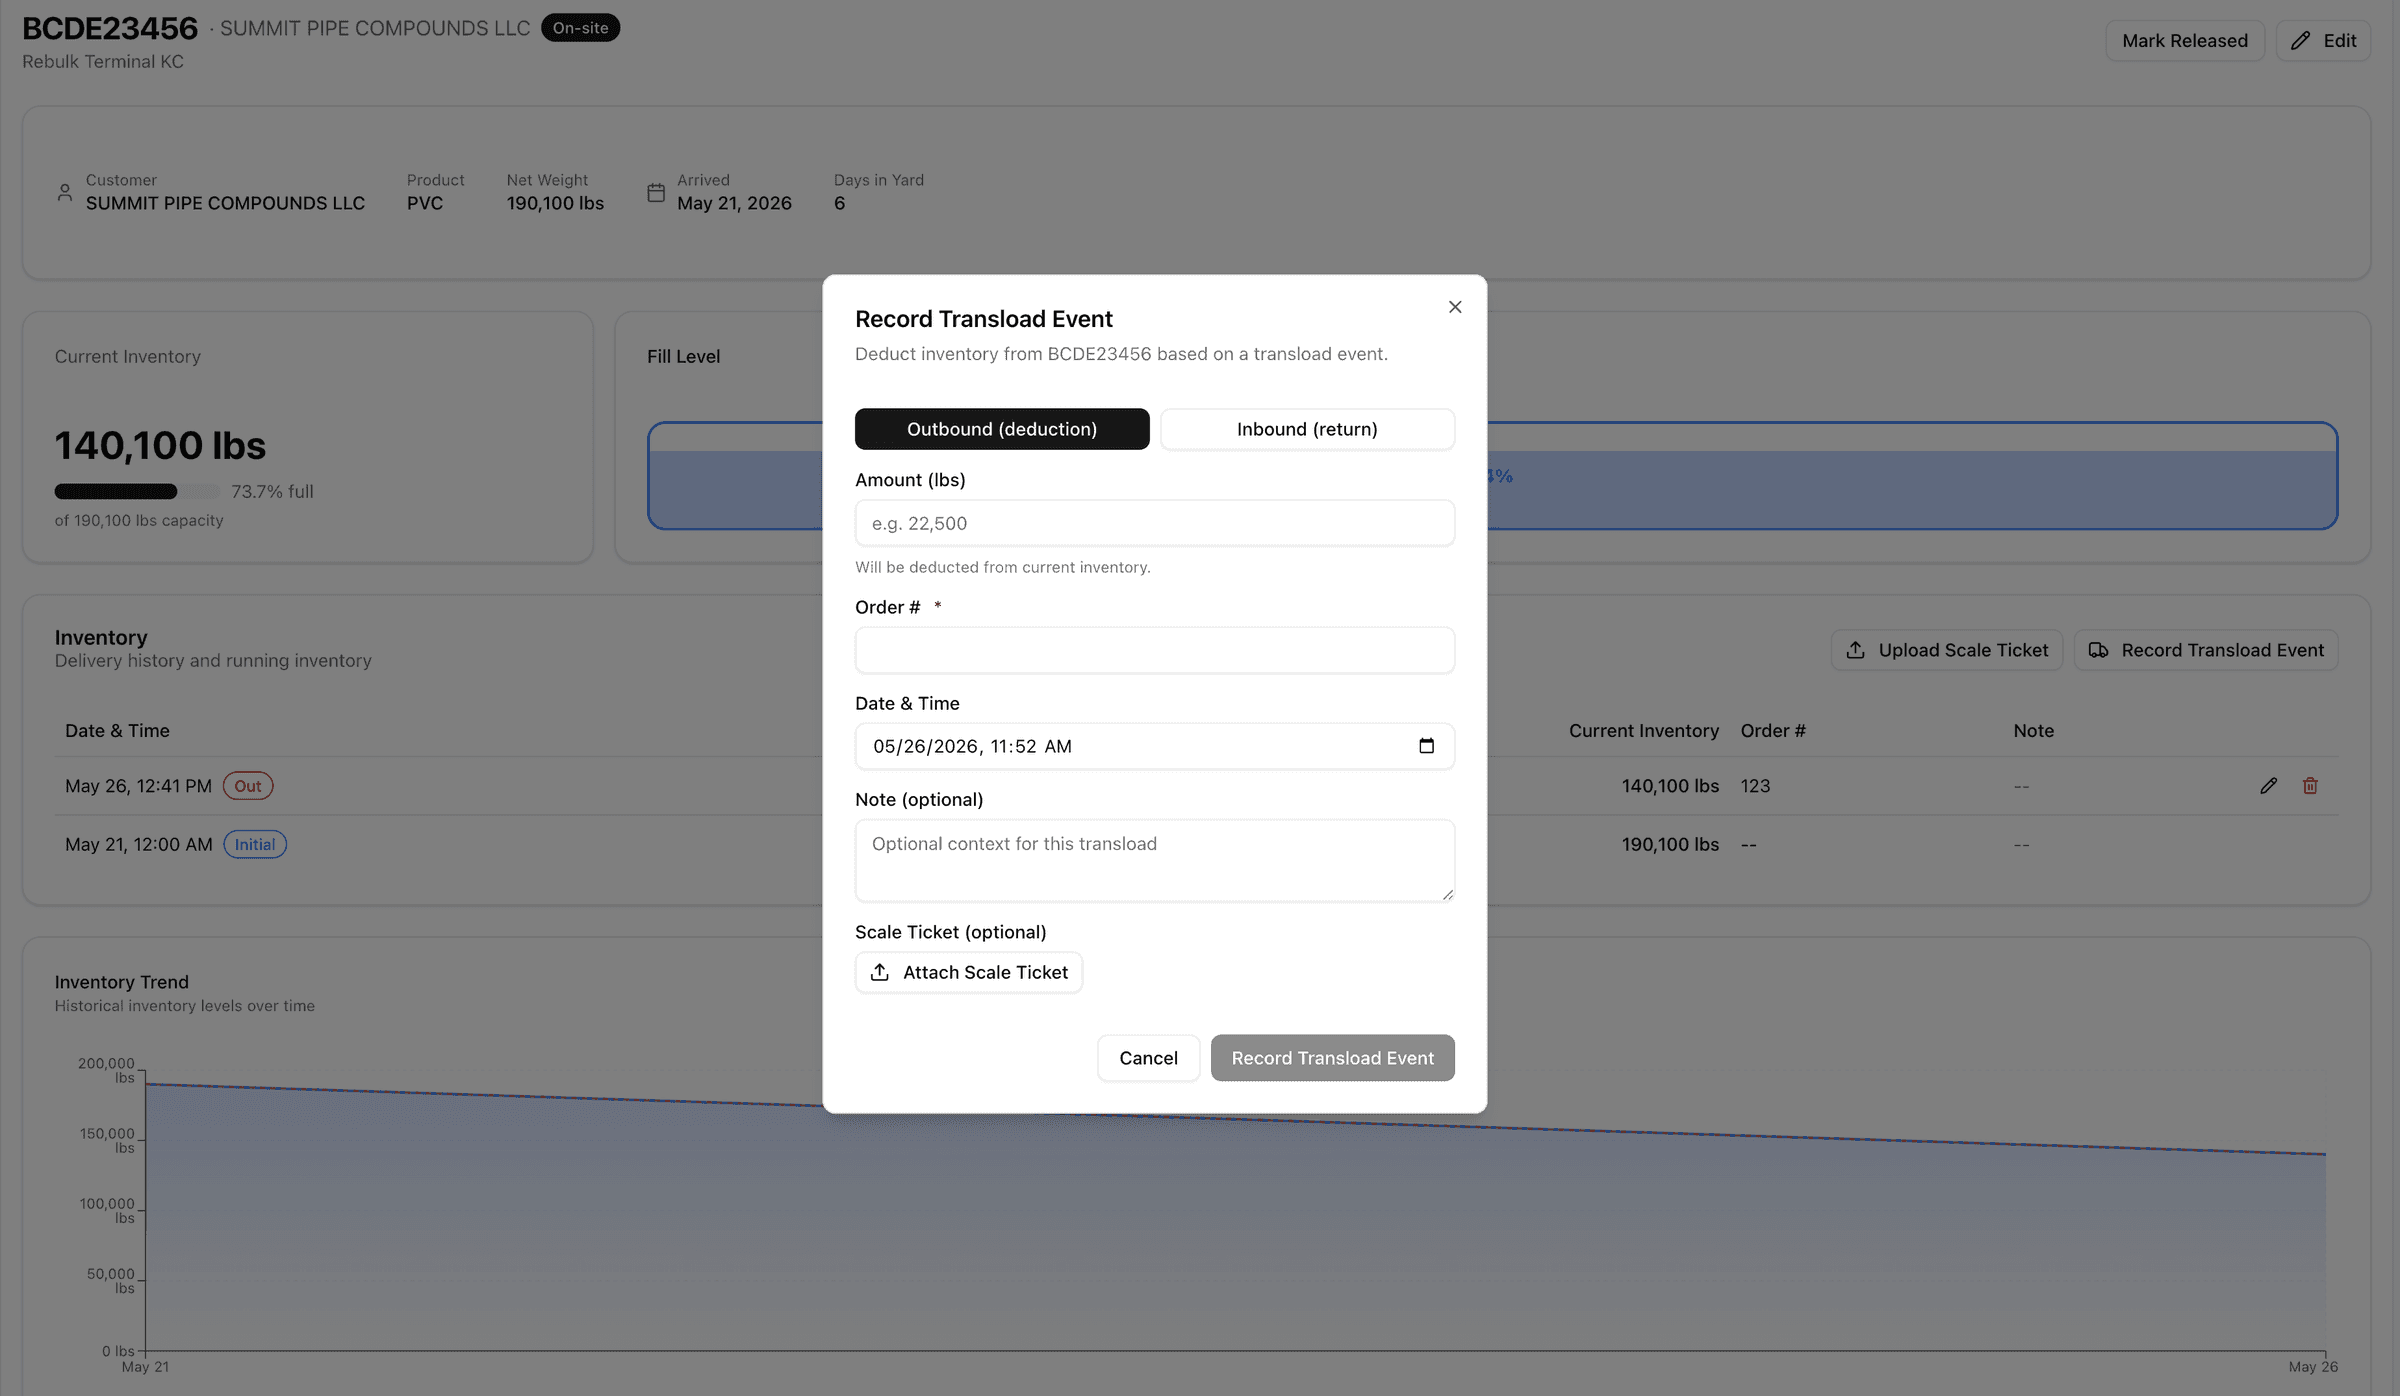
Rebulk Transload keeps each measured quantity attached to the customer, commodity, location, and railcar it belongs to, so storage billing and customer reporting rest on ground truth. Measured inventory drives the reports and invoices your customers see.
- Measured volume, not a running tally
- Ground surface modeled, not assumed flat
- Capture works offline and syncs later
- Every measurement is a point on a trend line
Products involved
Measurement and ownership, live today
Know what's on the ground, in the silo, and in every railcar — without a manual count.
The measurement
The ownership
Rebulk Inventory and Rebulk Transload are live and in production at bulk sites today.
The workflow
From a photo to a number you can bill from
Six steps, and only the first one happens in the yard.
- 1
Capture
Fly a drone, walk the pile with a phone, or leave a fixed sensor running. Field teams take photos; that is the whole job.
- 2
Model
Overlapping images become a dense 3D model of the pile and the ground surface under it, because bulk yards are rarely flat.
- 3
Measure
Bulk volume and packing factor give usable material, so piles with different internal structures compare on equal footing.
- 4
Attribute
Tons land against the customer, commodity, and location they belong to, alongside the railcar that delivered them.
- 5
Track
Measure the same site again and you have a trend instead of a snapshot: how piles grow, deplete, and move over time.
- 6
Reconcile
Measured on-hand sits next to receipts and shipments. Shrink surfaces while you can still do something about it.
Proof
Charm Industrial measures piles nobody could count
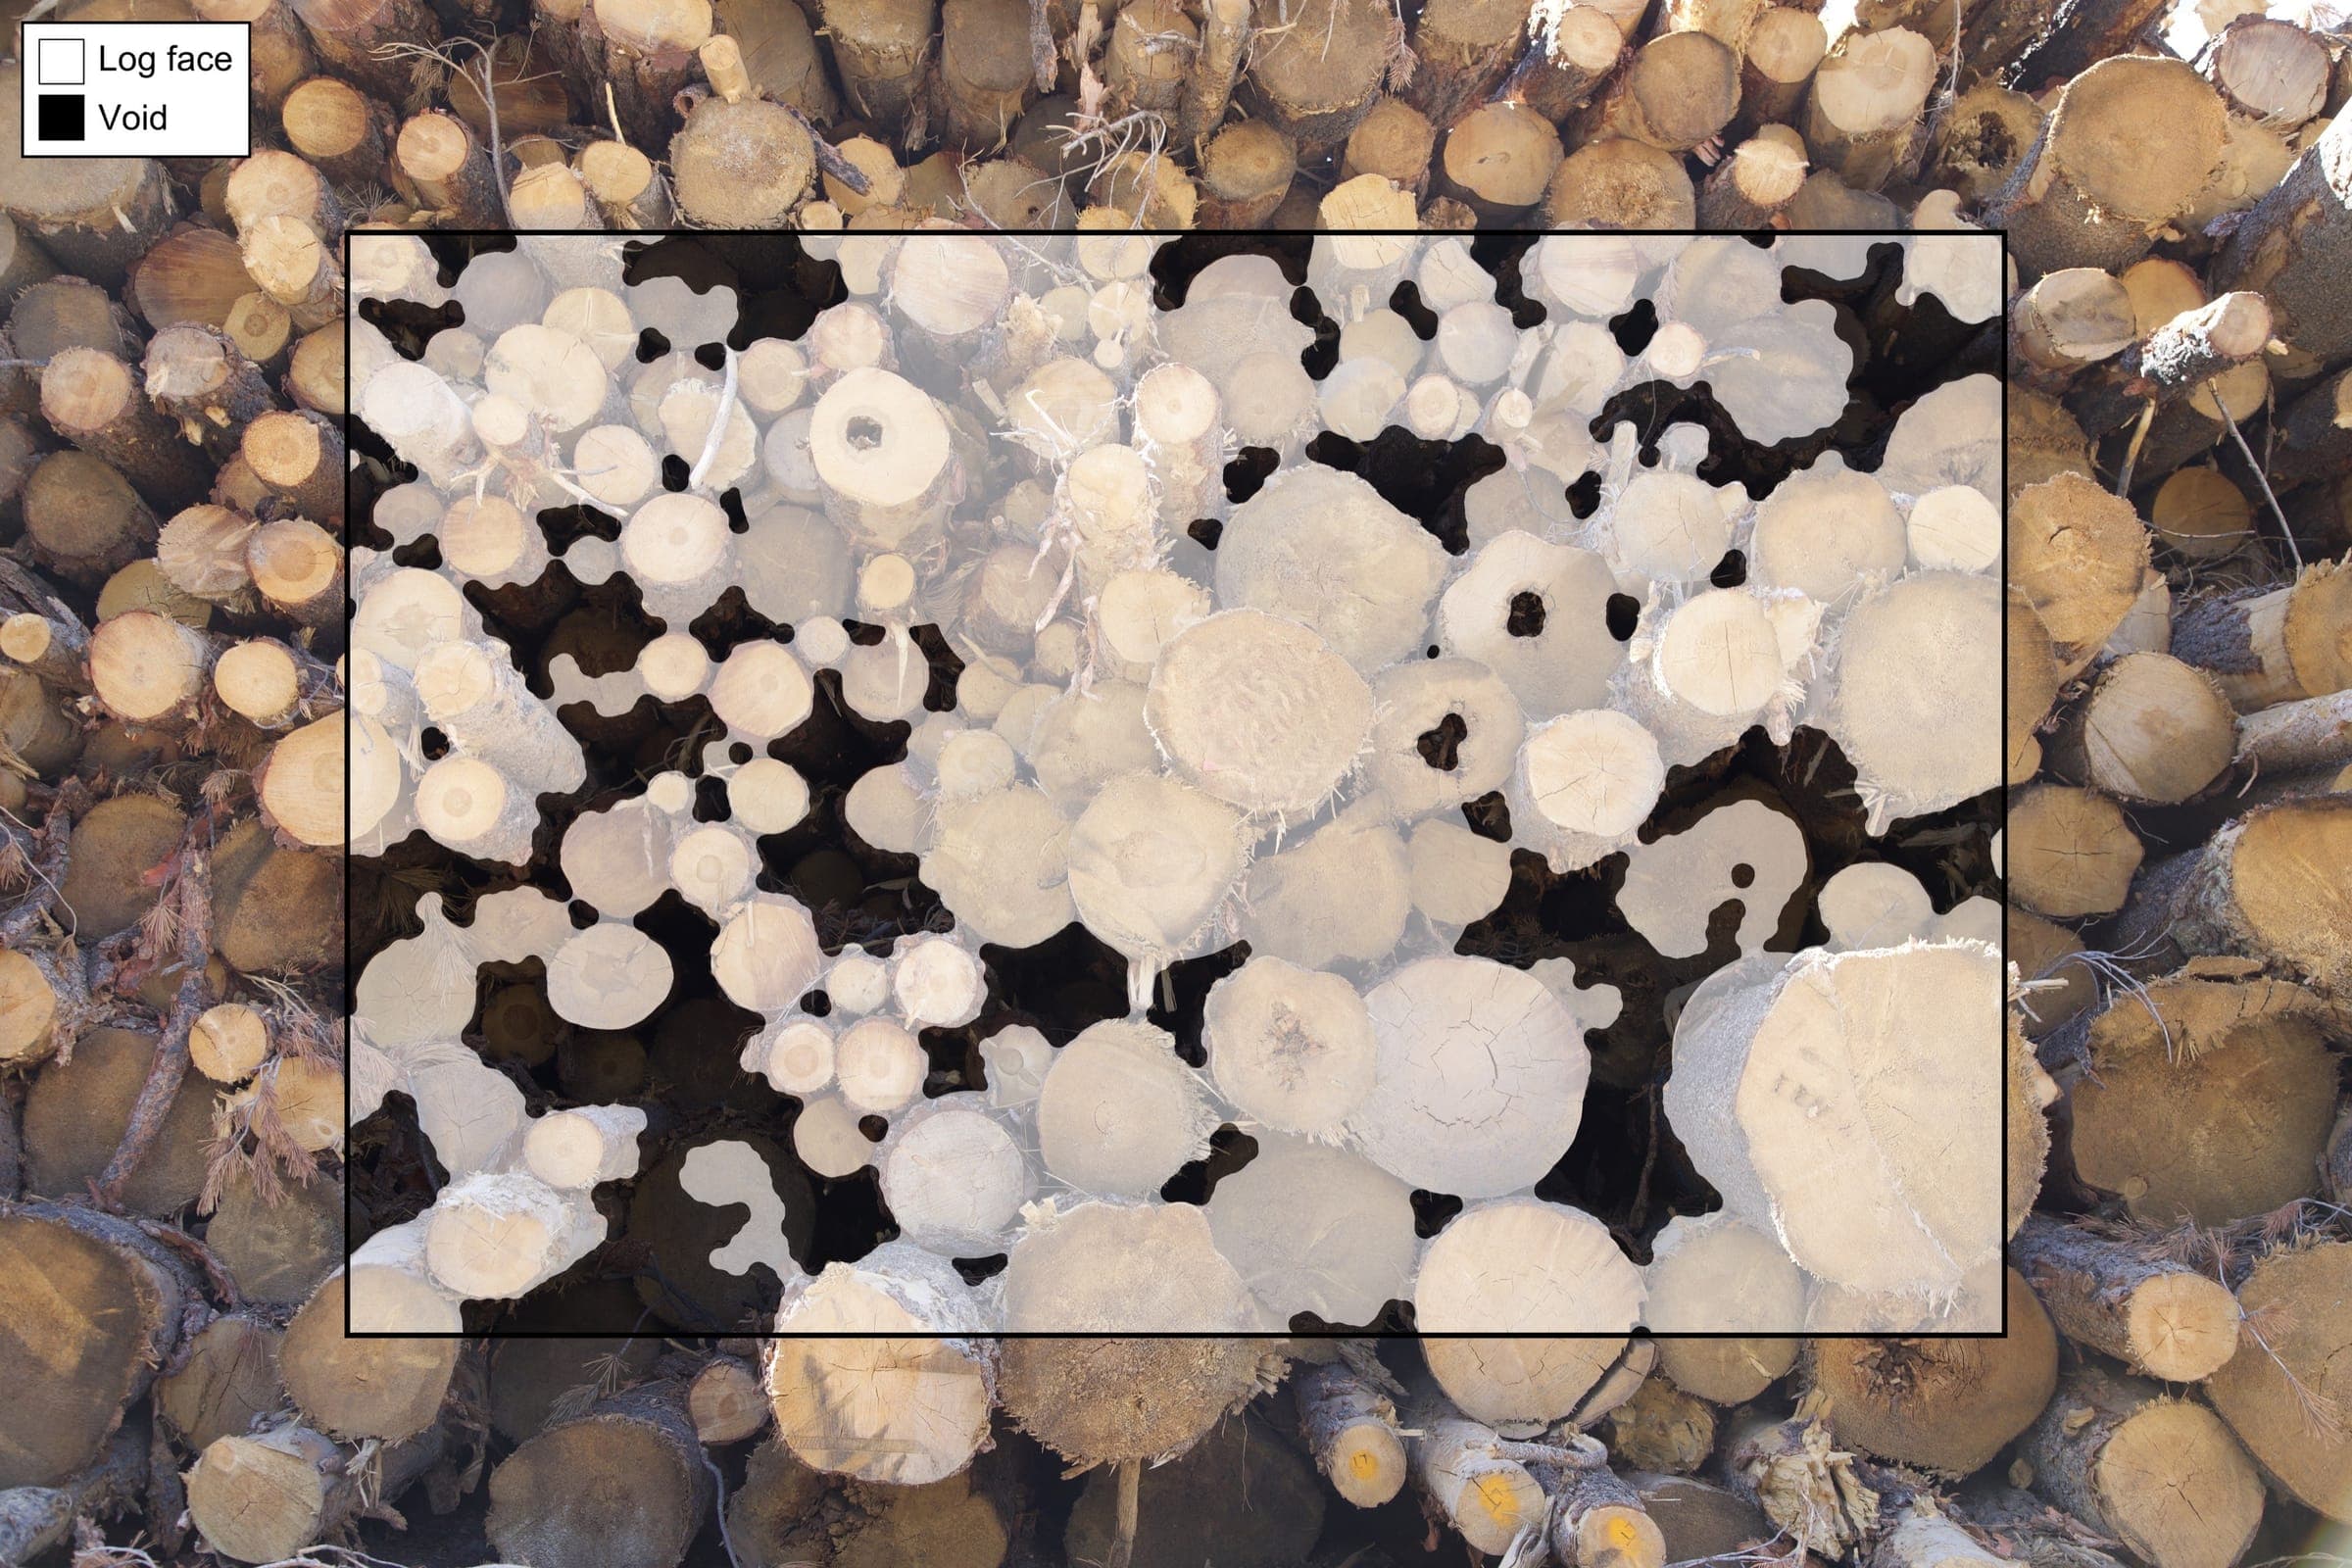
Charm's feedstock is log piles from wildfire resilience projects and corn stover baled in fields, stacked on sloped, uneven ground across remote sites. With Rebulk, operators capture scans on standard mobile devices and sync them later, which matters when the yard is in mountainous Colorado with spotty cell service.
- Accuracy across measured biomass inventory
- Greater than 95%
- Field team effort
- Take photos
Read the Charm Industrial story“Accurate measurement turns irregular piles into actionable data. Actionable data supports better operations. Better operations support scale.”
Put a measured number under your inventory
Send us one site: the material, the storage, and how you count it today. We'll show you what measuring it with Rebulk looks like, and what the number does between counts.